The numbers you steer by, and the reasons they moved, on one time line.
Each number is a card, compared with its own 7- and 30-day normal: it turns green or rose only when it really moved, and the reason you write beside it stays with it.
Dashbox is in early use and not on sale yet. There will be 25 test seats, and the waitlist is the way to one. Already have an account? Sign in.
Five places, and the reasons nowhere
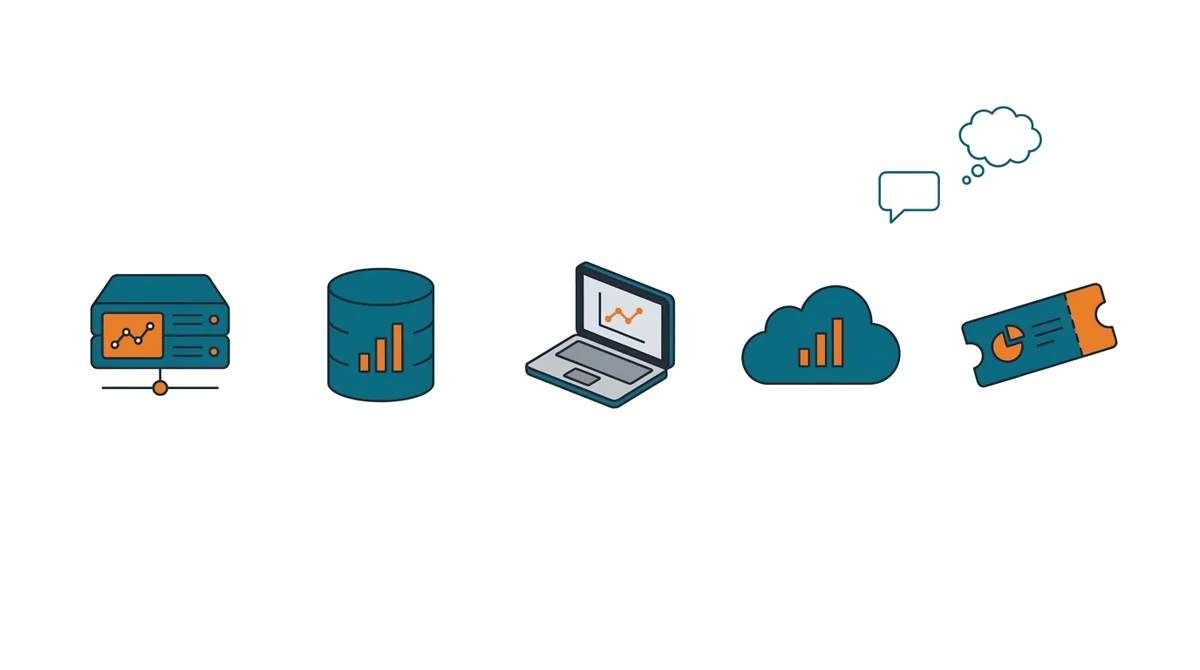
The numbers that matter live in five places - a shop, an event platform, a web database, an API account, a server - and the reasons they moved live nowhere: in your head, in a chat, in a meeting nobody wrote down. Dashbox brings each in as one card and keeps the meaning next to it.
How it works, in five steps
Each step is a chapter of the story, with the reasoning behind it.
Collect
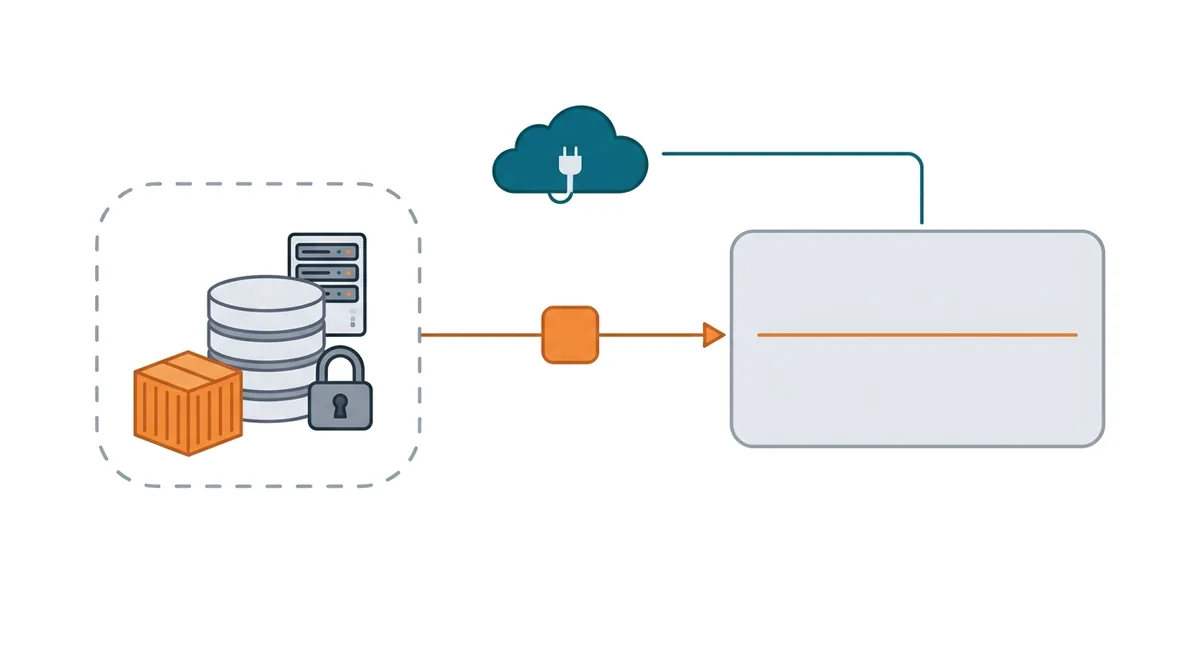
One number per card, from a public API (a template and a key, no code) or from a small container next to the data.
Chapter 2: A card gets its numberCompare
With its own normal: yesterday against the 7-day and the 30-day average. A missing average is a dash, never a made-up number.
Chapter 3: It learns its normalColour
Green or rose only when yesterday is above or below both averages, in the direction you said is good.
Chapter 4: It colours only when it really movedNote
Comments, periods and a target on the card's time line, with a history of every change of state.
Chapter 8: It keeps the reasonNudge
One push when a card changes state, never on every reading. This step waits for the app, which is in testing and not in the stores yet.
Chapter 9: It nudges you once
What makes it different
Colour only on a real move
A colour means something moved, not that it wiggled: yesterday has to be above or below both its averages. There is no percentage to tune.
Read chapter 4: It colours only when it really movedYour lines and your target
Set a low and a critical line, and the card turns amber or red when it crosses them. A target shows the day it was first reached.
Read chapter 5: It crosses a line you setEvents, not readings
A card is read many times a day; its history writes a line only when the card changes state - low, critical, stale, error, target reached, back to normal.
Read chapter 7: It writes down only what changedThe reason stays on the time line
A comment on the day, a period across the weeks, on the same time line as the number. Next month, the dip still has its reason.
Read chapter 8: It keeps the reasonPasswords stay where the data is
A small container next to your data sends only the summed values out. For a public API, the key is stored encrypted and never shown in full again.
Read chapter 2: A card gets its number
On your phone, and with the people you choose
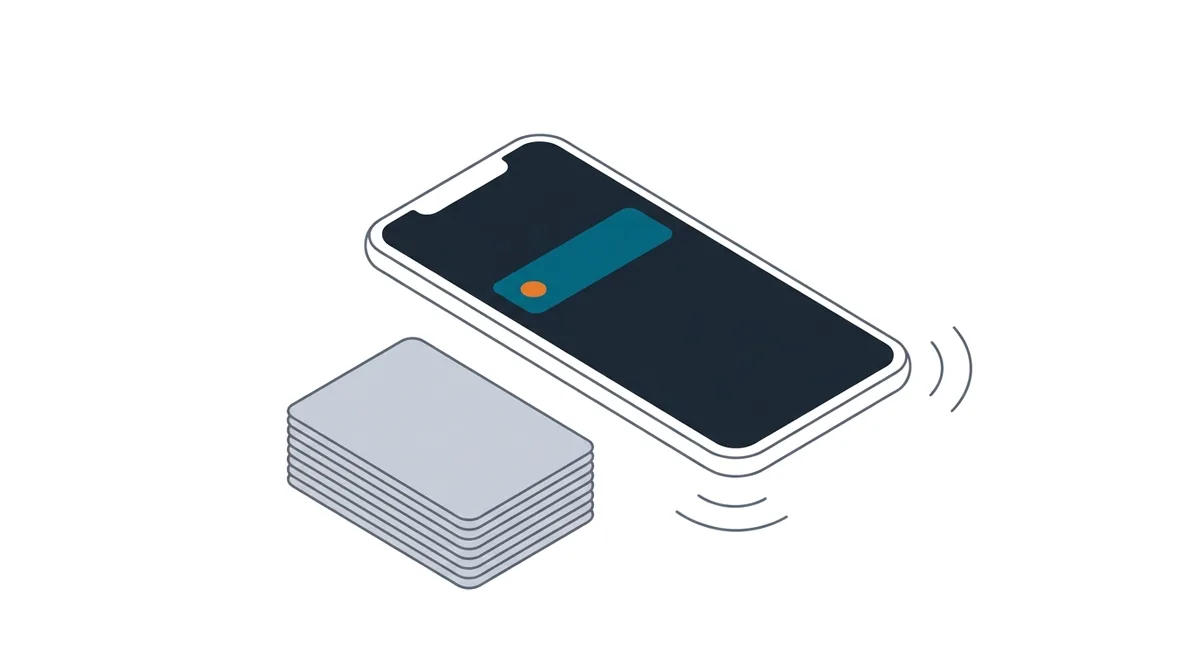
The app for Android and iPhone is in testing. It shows your cards and their time line; setting cards up stays on the web.
Sign in with a QR code
On the web, choose Sign in on your phone and scan the code with the phone. There is no password to type, and the code works once, for two minutes.
Share chosen cards
Pick the cards and send a QR code or a link, from the web or from the app. The person confirms their e-mail address with a 6-digit code and sees those cards, view-only - never where the numbers come from.
Stop sharing in one click
Take the access back from one person or for one card. The cards disappear at once, also from a screen that is open.
The app is not in the stores yet; join the waitlist to be among the first to try it.
How it works, step by step: support.
Every rule has a dated reason
Dashbox was not designed in one go. Up to 11 October 2026, the internal decisions log holds 52 dated decisions, and 73 change requests have been implemented. The story shows them, and every chapter ends with the reasoning behind its step.
What Dashbox does not do
It does not build charts, interpret your numbers or predict them. It compares, colours only on a real move, and keeps the meaning you add.
Questions
Who is Dashbox for?
For people who run several things at once and steer by numbers from several places - a product, an event, a shop, an AI bill. It is not a BI tool for a data team, and it has no chart builder.
How is it different from a dashboard tool?
A dashboard tool builds views of data you already have in one place. Dashbox brings in numbers that live in different places, one card each, compares each with its own normal, keeps the reason next to it, and writes down when a card changes state.
Where do the numbers come from?
Two ways. Dashbox calls a public API itself, from a template and a key, with no code. Or a small container runs next to your data and pushes the summed values, so database passwords never leave your side. Dashbox stores the numbers, not the rows behind them.
Is there an app?
Yes, in testing. The app for Android and iPhone shows your cards, signs in with a QR code from the web and shares cards; it is not in the stores yet. Cards are set up on the web, and push notifications come in a later version.
What does it cost, and can I sign up?
Dashbox is not on sale yet, and you cannot create an account yourself. There will be 25 test seats: join the waitlist, and we will write to you when a seat opens. The terms of the test are described when a seat is offered. Sign-in is for existing accounts only.
What happens to my data?
Dashbox keeps your cards, their readings, and your comments, periods and targets; keys you add are stored encrypted. There are no ads. What is stored, why, where it runs and how to have it deleted: privacy.
Try it on your own numbers
Dashbox is not on sale yet. Join the waitlist for one of 25 test seats, or read first how it reasons: one card's life, in nine short chapters.
Dashbox is made by Dolutions AB.